I'm not sure what to do for this yet and need to ask you about it as i was not here for it. Sorry!
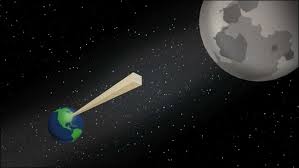 It would take 42 folds in half to reach the moon, but that’s unrealistic in that its phyically impossible to fold a piece of paper that many times. It would most likely be rather thick as you have folded it 42 times. The width matters as it would need to less than the length. The distance between the moon and earth is 384,000 km and if you were to fold the paper 42 times it would be a distance of 439,804 km.
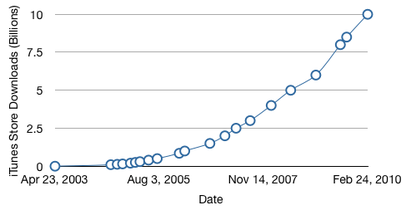 The graph shown looks as though it is an exponental function. Depending on how well itunes contunues to do will depend on the rest of the graph as it will change the domain and range accordingly. I think the graph will continue to grow but will evuntally decrease as we find other sources then itunes. The problem with trying to extend data as it is consitantly in flux and is ever changing which causes it to become unpredictable.
Based on the pictue, I dont think that the ball will make it in the hoop as the line it folows, shown in the picture, doesnt seem to end up passing through the hoop. It will most likely hit the rim and bounce off.
Something I learned from this assignment is that all even functions are symmetrical and all odds are not. I didn’t know that and it helps to determine which are even and which are odd functions. They are similar in that there is always a negative number in the point. They are different in that with even functions, only one number is negative, where in an odd function the left of the function is always two negative numbers. You can check weather its even or odd by either checking the points of the graph or using an equation to find if f(x) =-f(x) or if f(-x)= f(x), or looking at the graph to see whether or not it has symmetry. There are no families of functions that are ALWAYS even or odd, because as soon as its moved even the slightest bit all bets are off.
My predictions for where I believed the graph for the 21 inch ramp would end up were not overly far off. Most of mine were too far reaching to the right and didn’t have enough curve. The thing that led to the graph being the way it is was that using pervious knowledge of graphs I figured that the graph would end up looking something like I sketched in the first place. The zeros represent where the speed was zero and the skateboard was not moving. All of the graphs have a minimum maximum and zeros. Although all the mins and maxs are slightly different when distance is compared as well as the higher the ramp was, the faster and farther the skateboard went. When the graph rises quickly it is indicative that the skateboard had a lot of speed and was traveling the distance at a good speed. 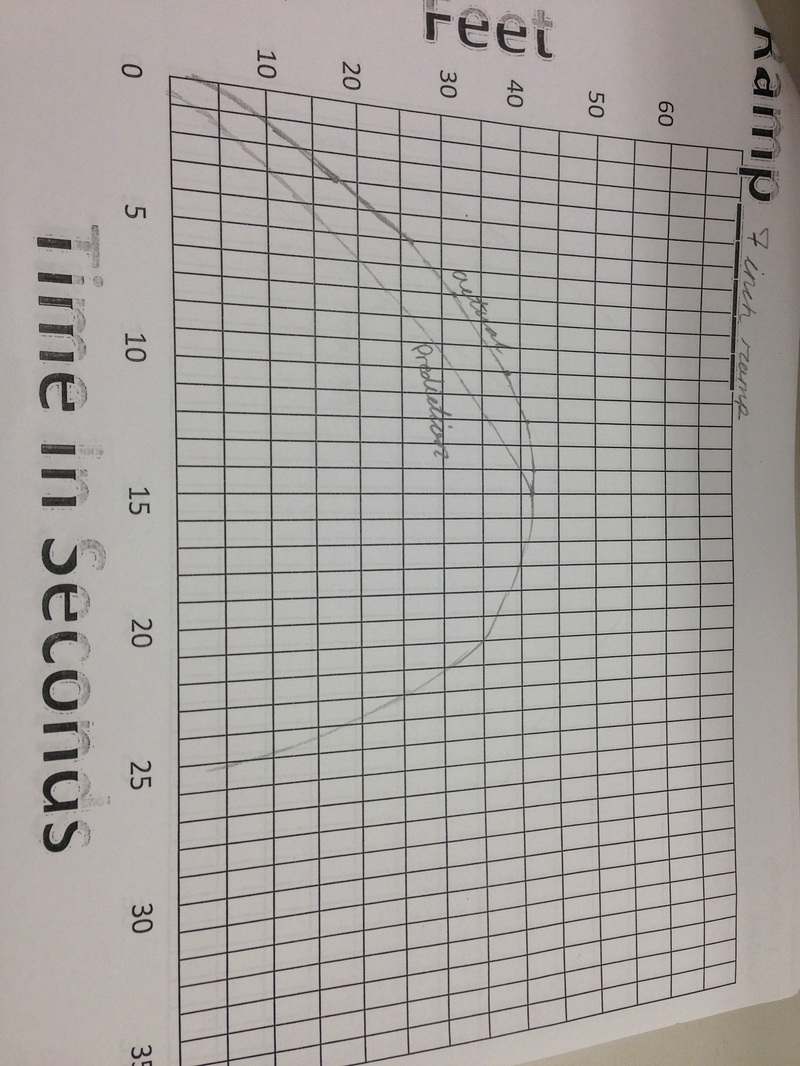 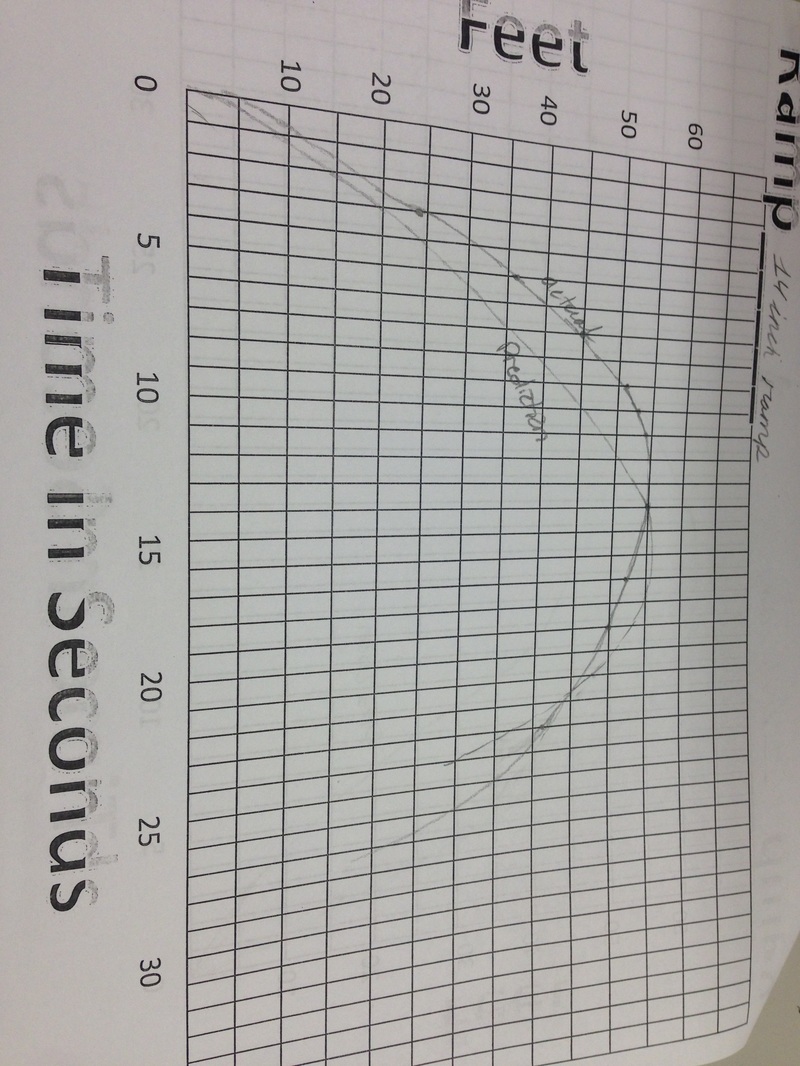 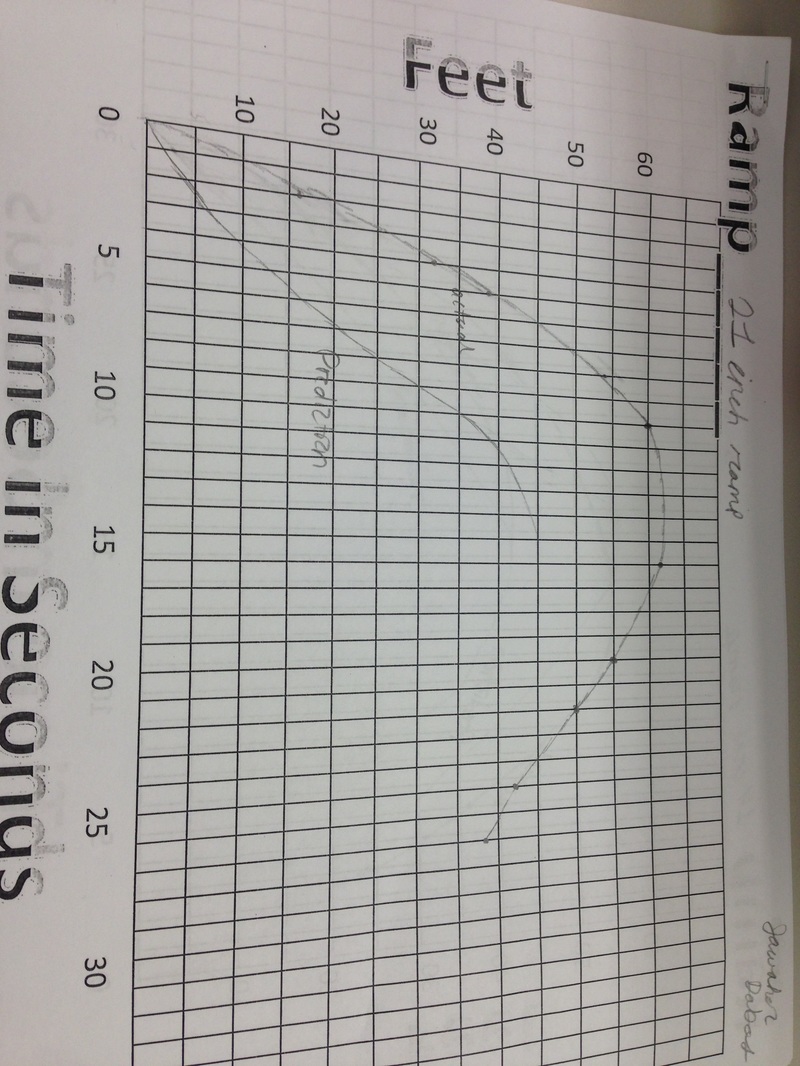 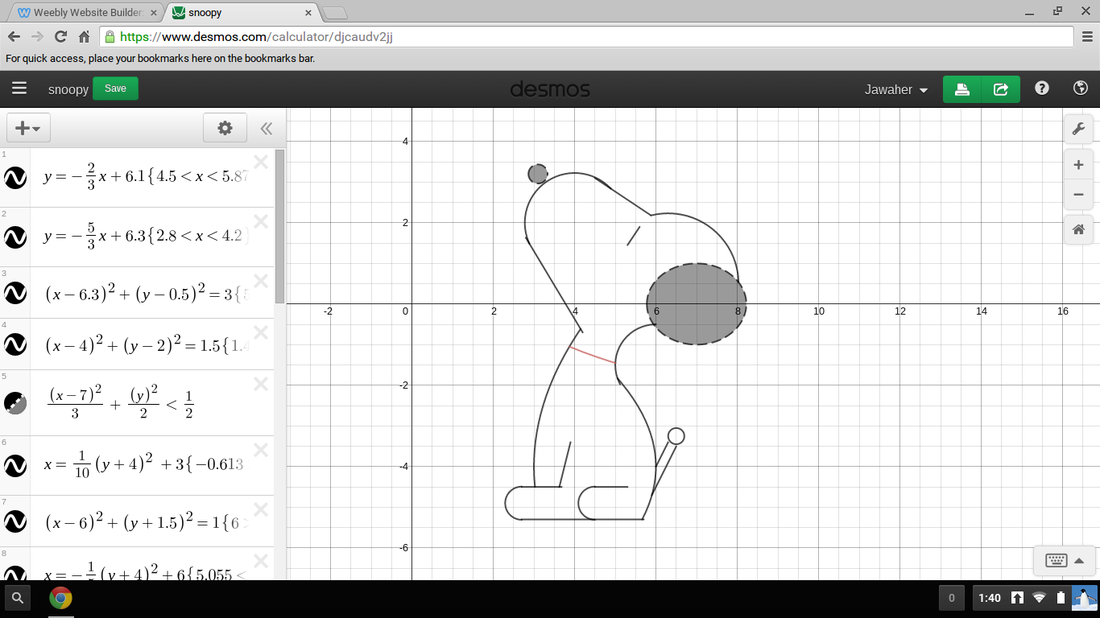 This assignment taught me how different functions can be manipulated and used to create different things. It also shows how changing or adding one number or letter can drasticly change the entire equation. The thing most difficult thing about this project was getting all the lines to fit together and create a picture, also getting all the equations to make the picture. I learned how to manipulate functions and move letters and numbers to create the correct equations and functions.
|
AuthorWrite something about yourself. No need to be fancy, just an overview. Archives
November 2015
Categories |
 RSS Feed
