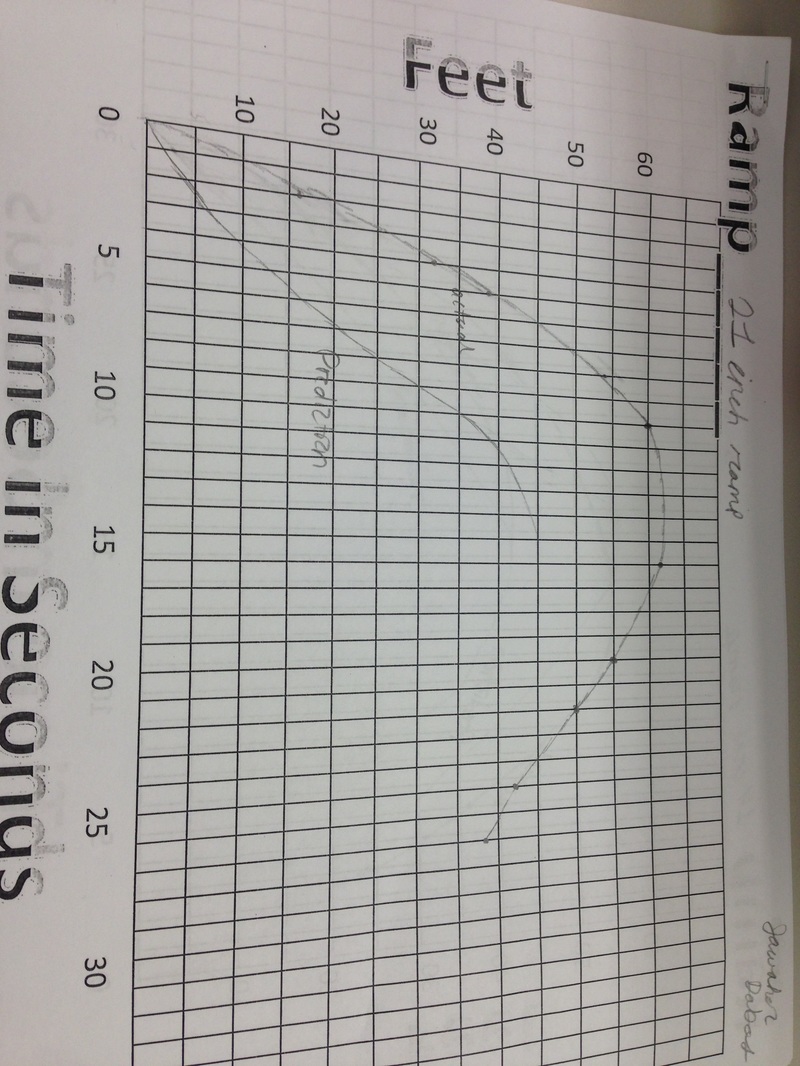
My predictions for where I believed the graph for the 21 inch ramp would end up were not overly far off. Most of mine were too far reaching to the right and didn’t have enough curve. The thing that led to the graph being the way it is was that using pervious knowledge of graphs I figured that the graph would end up looking something like I sketched in the first place.
The zeros represent where the speed was zero and the skateboard was not moving.
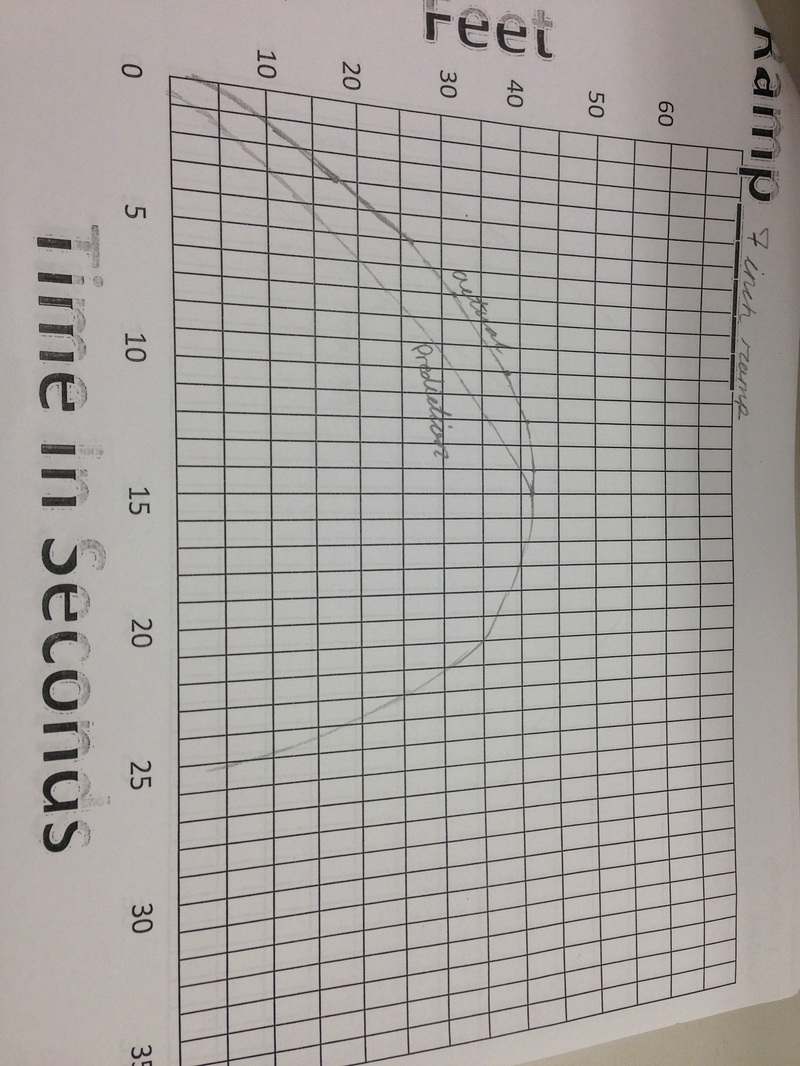
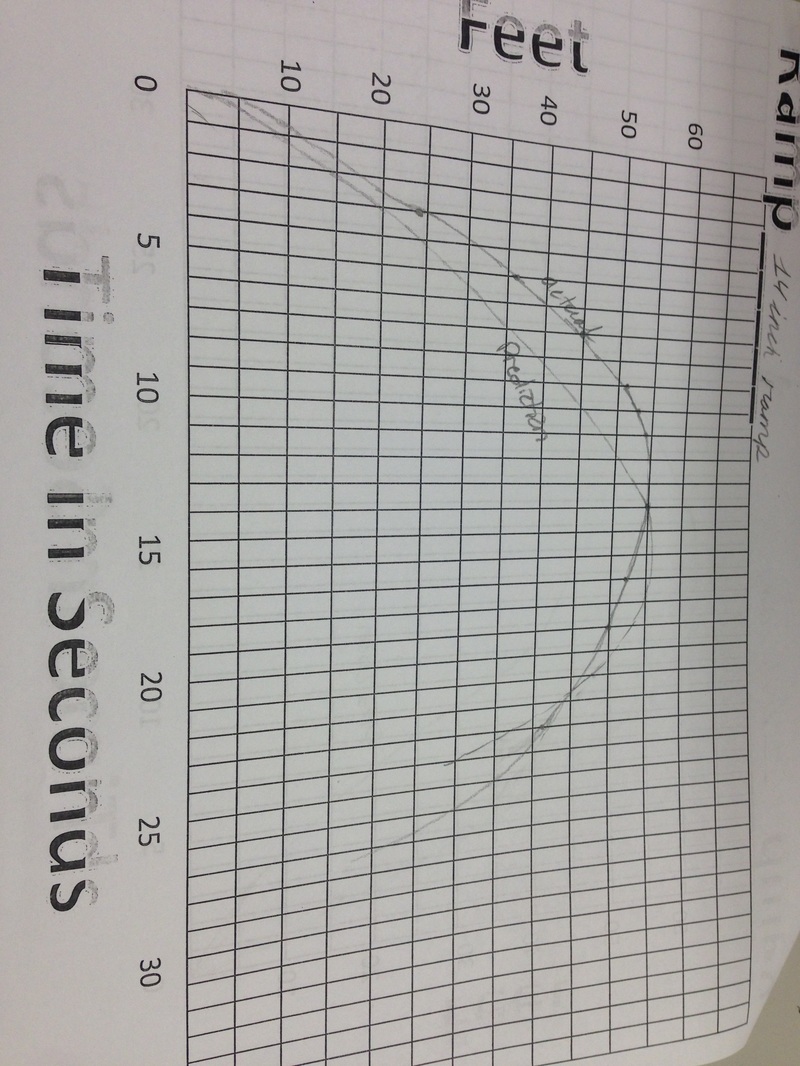
All of the graphs have a minimum maximum and zeros. Although all the mins and maxs are slightly different when distance is compared as well as the higher the ramp was, the faster and farther the skateboard went.
When the graph rises quickly it is indicative that the skateboard had a lot of speed and was traveling the distance at a good speed.
The zeros represent where the speed was zero and the skateboard was not moving.
All of the graphs have a minimum maximum and zeros. Although all the mins and maxs are slightly different when distance is compared as well as the higher the ramp was, the faster and farther the skateboard went.
When the graph rises quickly it is indicative that the skateboard had a lot of speed and was traveling the distance at a good speed.
 RSS Feed
